
Cardiology - (1) Cardiac cycle, (2) left sided changes, (3) right sided changes, (4) blood pressures and pulses at different sites, (5) conduction of action Potential, (6) ECG pptx, (7) Comprehensive paper on Cardiac EP. ____________________________________
1. Cardiac cycle
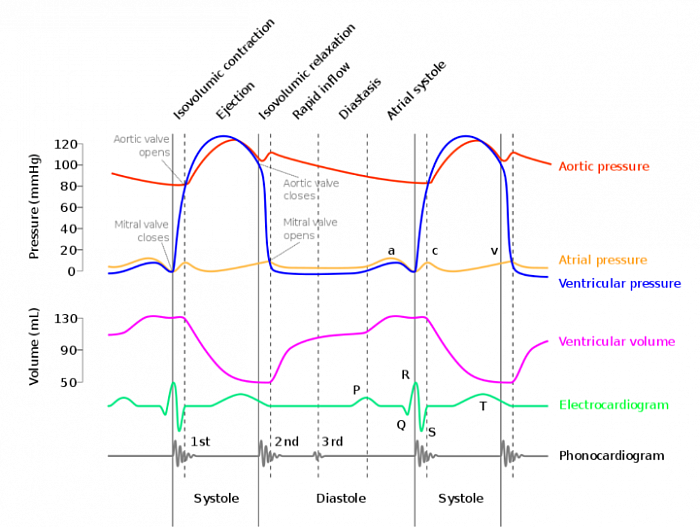
Wiggers diagram
- Heart is a part of vascular system, with its role as a pump running the blood to (1) the lung (pulmonary) system from superior and inferior venacava, through right atrium, right ventricle, pulmonary artery ramifying into capillaries surrounding lung alveoli. (2) After receiving blood from lung through pulmonary vein and left atrium, the left ventricle pumps blood to system through aorta, to capillaries of the system. Finally, through the systemic veins get it back to the right atrium.
- This journey of blood from point of entry in right atrium to exit from left through aorta is called a Cardiac cycle.
- So, you have some anatomy of each part of this circulatory system, some physiology, and consequent to the disease, some pathology. Medications and interventions come subsequently.
- In this haemodynamic system, you have changes in pressure, changes in volume during the movement of blood through the system, within a fixed period of time (60 sec/heart rate).
- These changes in pressure and volume at different places [inferior venacava, internal jugular vein, right atrium, right ventricle, pulmonary artery, pulmonary vein (measured as pulmonary artery wedge pressure), left ventricle, aorta, and peripheral pulse pressure] in a fixed time is a cardiac cycle.
- The pressure and volume changes on the left side of heart is summarized in Wiggers diagram. Sequences of events are synchronized with ECG & heart sounds.
Diseases cause change in volume and pressure changing the pattern of Wiggers diagram.
_________________________________
2. Cardiac cycle - temporal events on the left side
In Wiggers diagram (representing left side of the heart), cardiac cycle begins with systole followed by diastole; i.e. Heart rate 60/min, 1 cycle equals 1 second; systole (1/3) 0.33 sec, diastole (2/3) 0.66 second, are representative Durations.
- Systole phases -
1. Isovolumetric contraction: (0.05 sec) Both ventricles contracts with all four valves closed. As a result pressure builds up inside the ventricles. No change in volume, but pressure rises sharply, as you can see in the diagram. At the end of this phase Ejection phase begins with opening of aortic valve on left, and pulmonary valve on right side.
2. Ejection phase: (0.28 sec) Systolic ejection continues (through aorta from left ventricle to the systemic circulation giving systemic blood pressure, and through pulmonary artery from right ventricle to the pulmonary circulation giving rise to pulmonary BP). Pressure further rises and ventricular volume drops from 130 ml to 50 ml indicating 80 ml been ejected. So ejection fraction EF is (80/130 x100%) is 62%. Below 40% is reduced Ejection Fraction (rEF). Hemodialysis and transplant are difficult in this situation.
- Diastole phases -
3. Isovolumatric relaxation: (0.05 sec) After systole, ventricles start relaxation in closed chamber, with atrioventricular and pulmonary/aortic valve in closed position. As a result ventricular pressure drops and subsequently atrioventricular valves open.
4. Rapid filling phase: (0.2 sec) Right and left ventricles fill up rapidly from atrium because of drop of pressure. As ventricles fill up, pressure increases, and entry of blood slows down.
5. Diastasis phase: (0.2 sec) Entry of blood from atria slows down to a stasis called Diastasis.
6. Atrial systole: (0.2 sec) After the diastasis phase atria contract and push down blood further to the ventricles. This accounts for 30% of ventricular filling. [This amount is important during atrial fibrillation, when patients BP drops. At that time AF needs Cardiovertion to push this 30% venous return to increase BP].
- One cardiac cycle is completed. Cycle repeats again.
_________________________________
3. Cardiac cycle - Right sided pressure changes
Right sided pressures
- Jugular Venous Pressure (JVP)
- Right Atrial pressure
- Right Ventricular pressure
- Pulmonary Artery Pressure (PAP) and
- Pulmonary Artery Wedge Pressure (PAWP)
____________________________
- Pulse and pressure changes in the right atrium and right ventricle during cardiac cycle are reflected in the central vein (internal jugular vein) on right side as Jugular Venous Pressure and Pulse (JVP).
- On the left side Pulmonary Artery Wedge Pressure (PAWP) is reflective of left atrial pressure and venous filling. This is equivalent to the JVP on the right side.
- Pulmonary Artery Pressure (PAP) is the pressure of the pulmonary artery resulting from right ventricular systole and diastole.
- PAP normal value is 25/8 mmHg. When it exceeds 30 mmHg, it is pulmonary hypertension.
____________________________
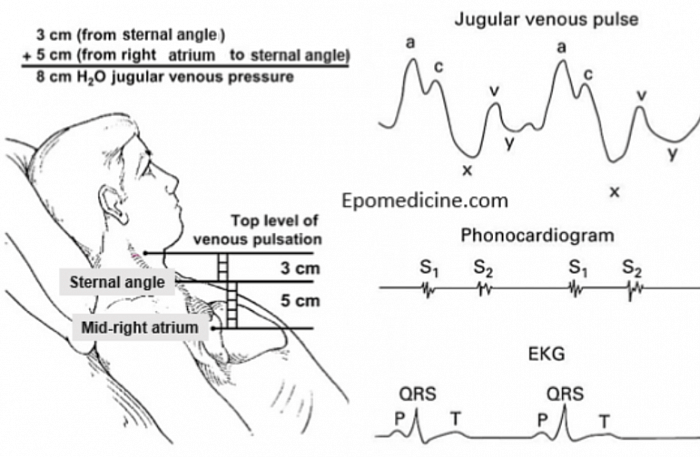
Jugular venous pulse and Pressure
- As shown in the figure below, in lying position JV pulse can be seen as a sinuous wave in contrast to carotid pulse which is a thurst visible and palpable.
- JVP is visible only, not palpable.
- JVP changes with respiration and position, it has an upper border at 45 degrees position when it is elevated.
- Normally is not visible at this propped up position.
- It can be obliterated by pressing its base at sternoclavicular area.
- It increases on pressure on abdomen or right hypochondriac area, called abdomino- or hepato-jugular reflux. This is not seen in inferior or superior venacaval block. In superior venacaval obstruction, JV will be engorged, but will not be pulsating.
JVP waveform:
It has three peaks (wave) and two descends. The sequence is a-c-x-v-y as shown in the figure:
- Peak a: right atrial systole. Canon wave is seen as a prominent a-wave when atrial contraction happens together with ventricular contraction in complete heat block.
- Peak c: isovolumetric contraction of right ventricle, also corresponds to carotid pulse
- Descend x: as right ventricular systole begins, right AV valve is pulled down. As a result pressure drops in right atrium and jugular vein, causing the x descend.
- Peak v: during later part of systole, pressure builds up in the right atrium due to venous return.
- Descend y: as ventricular relaxation starts, blood rushes into right ventricle from right Atrium causing JVP to drop giving y decent.
Jugular venous pressure, commonly measured as Central Venous Pressure (CVP) monitored by manometer is 8-12 cm of water.
_____________________________________
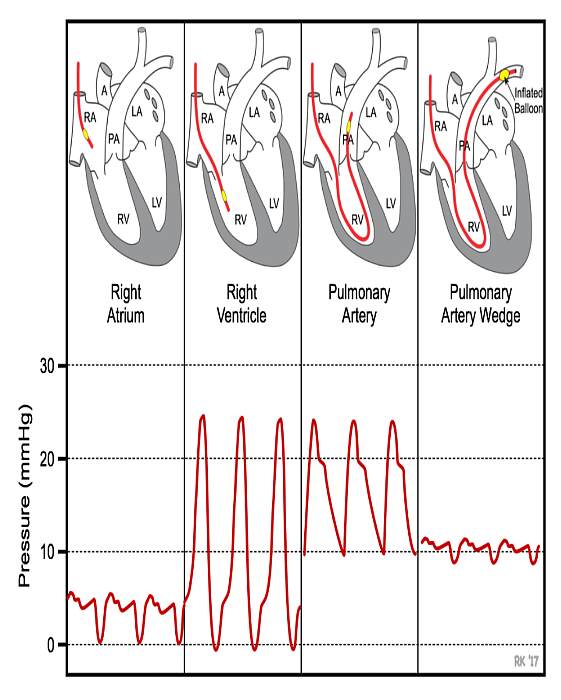
Pulmonary artery wedge pressure (Pulmonary Venous Pressure)
- Through right sided catheter, inserted into a small pulmonary artery and inflating the balloon, the artery is wedged, and the blood flow from right atrium is blocked proximaly. The distal tip of the catheter then measures pressure that is reflective of pulmonary venous pressure.
- As a result the distal portion of the pulmonary artery reflects the pressure changes and filing of the left atrium.
- The monitor at the tip of the catheter now reflects pressure of left atrium. It estimates the left atrial pressure. reflecting right ventricular output to the left atrium. Indirectly, venous Filling to left ventricle.
- A low value is obtained in either hypovolaemia or right ventricular MI or failure.
- High value is obtained in mitral stenosis or left ventricular failure.
- Normal value is 8-10 mmHg.
____________________________________
Jugular venous pulse and pressure shown in this figure
___________________________________________
4. Pressure changes during cardiac cycle
- Blood flows according to the pressure gradients. Therefore blood pressure varies at different levels of circulation. Hence named according to the place of blood pressure.
- In the diagram, the names and respective pressures at normal circumstances are shown.
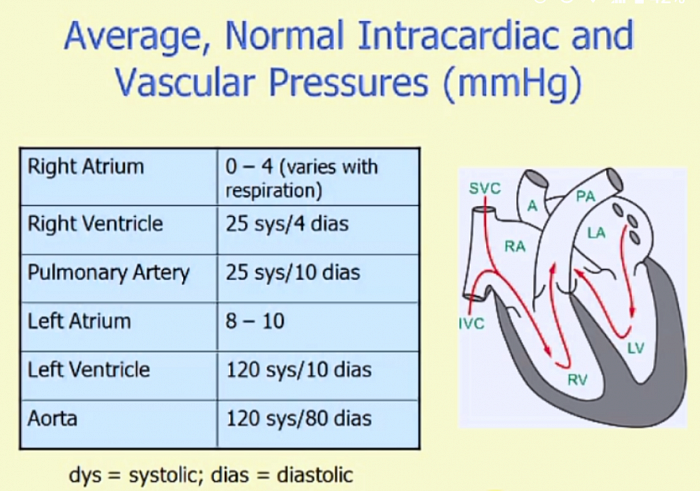
Blood pressures
______________________________________
5. Action Potential (AP) generation and conduction
- The P Wave is initiated in atria at SA node with contraction of the atria, and transmitted to AV node through four intra arterial fiber. 0.08 sec
- P wave should precede every QRS complex.
- The QRS Complex is associated with contraction of the ventricle. (0.08 sec)
- The PR (isoelectric line) The beginning of the P wave and beginning of the QRS complex. (0.12-2)
- The ST Segment: 1 mm down for ischaemia and 2 mm up for infarction; concave upward indicates Pericarditis.
- The T Wave represents ventricular repolarisation.
- QTc Beginning of Q and end of T, 0.36-0.44, (correction for rate required QTc= QT/√RRsec)
- Impulse originates from the Sinoatrial node.
- RR interval for rate calculation, (small marks between 2 R peaks)
- Heart rate= 1500/RR interval number of small squares. 0r 300/RR number of large squares.
7. A comprehensive paper on Cardiac EP
___________________________________
